Wednesday, October 23, 2024

Oracle EPM using the Trace Traffic Tool


Oracle EPM Trace Traffic Tool

Use the Trace Traffic tool to view network traffic logs easily in real time, capture them, and import them for further diagnostics.

Oracle Smart View for Office's built-in Trace Traffic tool helps users to view and capture network traffic details specific to Smart View in real time, and improves Oracle Support's ability to debug issues.

The Trace Traffic tool is available starting in Smart View release 24.200.

Using the Trace Traffic tool, you can:

Viewing and Capturing Network Traffic Logs

You can either start diagnostics before starting the network traffic trace or you can directly start tracing network traffic without starting the diagnostics first. Network traffic logs are also captured when you use the Start Diagnostics option. However, with the Trace Traffic option, you can view the request and response logs in real time in the Network Traffic Trace dialog.

To view and capture network traffic logs in real time:

  1. On the Smart View ribbon, under Diagnostics, click Trace Traffic.

    Note:

    The Diagnostics group actions appear on the Smart View ribbon when you enable the Show Diagnostics Group on Smart View Ribbon option in the Options dialog, Advanced tab.

  2. In the Network Traffic Trace dialog, select the Smart View Traffic option from the Capture list, and click Start Capturing.

    You can view the network traffic details comprising the request and response logs getting captured in a chronological order.

    • To see the request and response timestamps for each log entry, select the Show Times check box
    • To clear all the request and responses that you can view in the current session in the Network Traffic Trace dialog, click Clear. Note that only the view is cleared. The network traffic log files are not deleted from the Diagnostics folder.

    Note:

    • Once clicked, the Start Capturing button toggles to Stop Capturing .
    • You can always start tracing traffic without starting the diagnostics first. When you click Start Capturing in the Network Traffic Trace dialog, the Start Diagnostics menu automatically toggles to Stop Diagnostics indicating that the diagnostics are being captured along with traffic details.
  3. Once you have captured the actions you want to trace, then click Stop Capturing and click Close to close the Network Traffic Trace dialog.

    The network traffic logs are stored in the Diagnostics folder in this default location:

    C:\Users\[computeruserfolder]\AppData\Roaming\Oracle\SmartView\Diagnostics

Oracle Hyperion 11.2.19 release Oct 24 2024 Update

 Oracle Hyperion 11.2.19 includes the following new features

  • Essbase 21c (version 21.6) is now certified and supported.
  • Microsoft Active Directory 2022 is now certified and supported.
  • Support for Non-SYSDBA Users for Essbase Configuration.
  • Java 8 Update 421.
  • WebLogic Patch Set Update 12.2.1.4.240710.
  • Application Data Framework (ADF) Bundle Patch 12.2.1.4.240605.
  • Oracle HTTP Server (OHS) 19c Bundle Patch 12.2.1.4.240619.
  • There are no Oracle Data Integrator (ODI) Patches in Release 11.2.19.
  • Starting with Release 11.2.17, dependency on Microsoft Visual C++ 2010 has been removed and Oracle Enterprise Performance Management System will not be installing Visual C++ 2010. 
  • However if it is already installed, it won’t be uninstalled. Oracle Enterprise Performance Management System will function with or without Visual C++ 2010. 
  • If you want Microsoft Visual Studio 2010 to be removed from your machine, see Removing Visual C++ 2010 for more details.

Wednesday, October 16, 2024

Oracle EPM Planning Audit Feature and Reporting !

Oracle EPM Audit feature provides a huge amount of information that can help Administrators troubleshoot a variety of issues.

The number of tasks available to audit has steadily increased over the last few years. As of today, there are 18 items available to audit.

The most useful features so far that I have found are Data, Dimension Administration, and Launch Business Rules. Analyzing these has helped me to troubleshoot issues with data, who ran a rule and when, or if the metadata has been altered. 

But by having all enabled, I can review many other types of changes that have occurred. 

And all of it is exportable to an Excel file. Plus, it might be the easiest thing to configure in Planning.

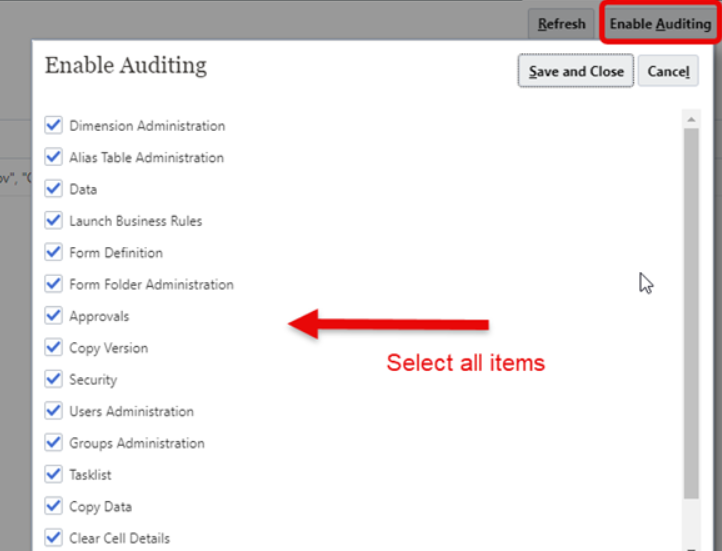
To get started, auditing needs to be enabled. 

Go to Navigator > Tools > Audit.


Click on Enable Auditing and select all the available items in the list, then click Save and Close.


Once auditing has been enabled for a few days, you will be able to see all the information.

From the Audit Filter page, you can review or select various tasks for your reports.


Select a date range for the information. You cannot select a range greater than 180 days from here, but you can select up to 365 days by using EPM Automate.


The page will display the first 200 records. Click Export to export to an Excel file.

Thursday, October 3, 2024

EPM Automate Support of Task Manager Commands

EPM Automate Support of Task Manager Commands

EPM Automate now supports the following Task Manager-related commands:

  • deployTaskManagerTemplate
  • exportTaskManagerAccessControl
  • runTaskManagerReport
  • setDemoDates

deployTaskManagerTemplate: This command deploys tasks from a Task Manager template into a task schedule ensuring consistent execution of repetitive business processes.

exportTaskManagerAccessControl: This command exports the details of users assigned to work within Task Manager to an Excel or CSV file.

runTaskManagerReport: This command generates reports that display data from Task Manager.

setDemoDates: This command helps you update the dates associated with tasks in Oracle internal demo data such as start date and end date of tasks, and ancillary dates including those of history, individual workflow due dates, and start date (actual).

Business Benefit: These commands enable the remote administration of Task Manager-related operations in Enterprise Profitability and Cost Management environments.

Generative AI for Management Reporting Narratives - Oracle EPM

 Generative AI for Management Reporting Narratives

Reports provide the ability to utilize Generative AI (GenAI) for generating narrative summaries in a text box. It is used for the following three use cases:

  • Describing exceptions: Describe the cell(s) where a condition is satisfied. For example, a grid cell that satisfies the variance threshold defined by the report designer as a condition.
  • Describing the causality for exceptions: Examine one of the relevant cell dimensions where the condition was satisfied and describe the top 3 contributors to it.
  • Performing a comparative analysis: If the grid has prior time periods in the columns, describe the cell value in comparison to the prior period.

The generation of narrative summaries within a report is exposed via the conditional text framework with corresponding machine learning property files (Prompt Template properties file) for each use case, which provides examples to generate the textual narrative via GenAI. Conditional text is defined for rows, columns, or cells, and if the condition is satisfied, the GenAI service returns the resulting narrative text using the ConditionalText text function.

NOTE

  • The Reports GenAI feature is only currently available in EPM Cloud Enterprise Narrative Reporting deployments. It is not available in Oracle Enterprise Performance Management Cloud Platform application deployments, in the Standard EPM Cloud Narrative Reporting deployments, or Legacy Enterprise Performance Reporting Cloud Service (EPRCS) deployments.

  • The GenAI feature is available only for OCI environments, and it is not yet available in all OCI regions. To view the regions where it is available, please refer to the OCI (Gen 2) Geographical Regions and Identifiers section of the Oracle Enterprise Performance Management Cloud Operations Guide.

  • For the initial release, narratives will only be generated in English.

  • The Reports GenAI feature is a decision support tool. End users make any final decision regarding the interpretation of the information it provides. AI should be treated as a decision support tool only. Always review AI-generated content and verify its accuracy before using or relying on it.

We developed three sample GenAI Reports to help you learn more about the GenAI functionality. For more information, refer to the following links:

Business Benefit: GenAI can bring more intelligence to reporting and analysis to aide decision-making in finance.

Steps to Enable

Enabling Generative AI in Narrative Reporting

Currently the Generative AI (GenAI) service is not available in all data centers. If GenAI is available in your data center, you can enable it from the Tools Settings card.

To enable GenAI, follow these steps:

  • On the Narrative Reporting Home Page, select Tools, then select Settings.
  • In the Settings window, in the left panel, select Generative AI

NOTE: If the Generative AI is not available in your data center, the Generative AI panel displays “Generative AI is not available”.

  • Click on the checkbox to Enable Generative AI, then click Save.

Updated Admin Extension for Oracle Smart View

Updated Admin Extension for Smart View

An updated Admin Extension extension for Oracle Smart View for Office is now available to download and install. This update contains additional debugging information useful for Smart View’s new Trace Traffic tool.

Applies to: Enterprise Profitability and Cost Management, Financial Consolidation and Close, FreeForm, Planning, Tax Reporting

The Admin Extension allows Service Administrators to quickly import and edit dimension and member metadata directly in Smart View. 

The Admin Extension is also referred to as the Smart View Add-on for Administrator or the Planning Admin Extension.

Smart View’s new Trace Traffic tool enables users to view network traffic details comprised of request and response logs in real time. 

Oracle Smart View for Office 24.200 is required to use the Trace Traffic tool. 

The updated Admin Extension contains additional debugging information that is enabled at run time when using the new Trace Traffic tool.

Business Benefit: With the updated Admin Extension, users can take advantage of the Trace Traffic tool available in Oracle Smart View for Office 24.200.

Steps to Enable

You can update the Admin Extension in either of these ways:

  • From the business process Downloads page, download the Admin Extension SVEXT file available under Planning Extensions, and then double-click the SVEXT file to install it.
  • From the Smart View Options dialog, Extensions tab, click Check for Updates, New Installs, and Uninstalls, then follow the prompts to download and install the Admin Extension.